Who is going to win the European Championship? This is what our statistical model predicts
EL PAÍS once again predicts the outcome of the tournament. France and England start as favorites, although 60% of the time another team will win. Predictions are updated every day
What are the chances each nation has of winning the European Championship? We look at this question by simulating the outcome of the tournament thousands of times. This way we can calculate how likely it is that each team will to reach the round of 16, or win the tournament.
| TEAM |
|---|
| EP INDEX | ROUND OF 16 | QUARTERFINALS | SEMIFINALS | FINAL | WINNER |
|---|
The table above shows which teams are the favorites and by how much. The data also demonstrates the enormous uncertainty of the playing field. Soccer is an unpredictable sport, and our model knows that: that’s why, although France is the favorite, it says that 80% of the time Les Bleus will end up being knocked out.
This is the third time EL PAÍS has published predictions for a tournament, after the 2018 and 2022 World Cups. The full methodology can be read at the bottom of the page, although the essence of the model is simple: we feed it with data on the results of each national team and the quality of its players, and then simulate the tournament thousands of times.
By clicking on the button below you can simulate the European Championship with our model and see who wins. If you click again, you will perform a second simulation and in all likelihood another team will win. Your winners accumulate in the table.
If you spend some time playing with this, you will see that the winning percentages align with the table at the top of the page. It will do so slowly, because that’s how chance works.
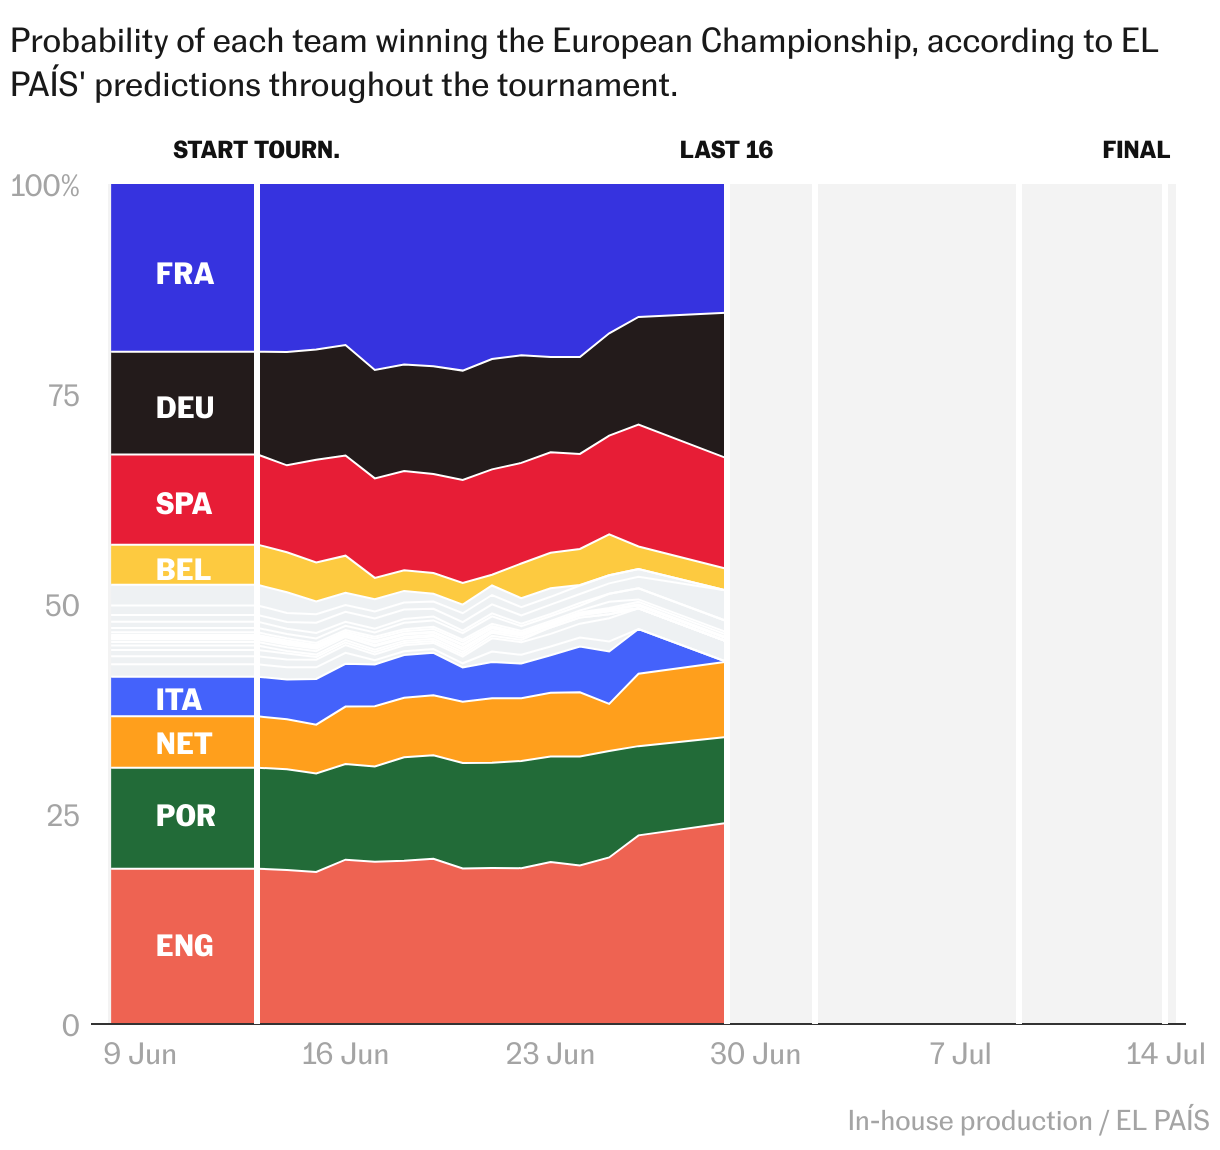
How the favorites have changed
Each day we will update the predictions and save the previous ones. In the selector in the first table in the page, you can see what our model said each day. In addition, in the chart below, we collate the evolution of our predictions throughout the tournament:
Predictions in the final stage
The table shows the odds of each team passing its Round of 16 matchup. From the quarterfinals onwards, we show the two teams with the best chances of reaching that stage, and two percentages: each team’s odds of reaching the stage and beating its opponent.
What other predictions say
We are not the only ones making predictions! Every year there are more and more companies, communities, and fans who are encouraged to crunch their own numbers. In this table we collate three interesting sources: the statistical model of sports statistics company Opta, the average prediction of a selection of betting companies, which are usually the most accurate, and finally, the prediction of Metaculus, a U.S.-based community of forecasters.
| TEAM |
|---|
| EL PAÍS | BOOKIES | METACULUS | OPTA |
|---|
How does our model work?
Our predictions are the result of thousands of simulations, which are only partly random. In each match, the probability of one team or the other winning depends on their statistics. For example, if France plays against Albania, the probability of the former winning is around 83%.
The model consists of three parts:
1. How strong is each team? To decide this, we use two metrics: their recent results (measured with an ELO ranking, a method originally from chess) and the quality of their players (measured by their value in euros, with data from the Transfermarkt website).
2. Who wins each match? We have trained a model with thousands of matches to — given two teams and their strength metrics — estimate how likely each outcome is. The model gives the probability of victory, draw and defeat, and even the score. For example, in that hypothetical duel between France and Albania, the most likely outcomes are 2-0 and 3-0 to France, each with a probability of about 14%.
3. And to predict the entire European Championship? What we do is to simulate it match by match, potential opponent by potential opponent. We repeat it thousands of times to reach 200,000 possible tournament outcomes, and thus be able to estimate the probability of each event.
Frequently asked questions
So you say France will win? No, no. Our model says that France is the most likely winner, but also that it has only a one-in-five chance of winning. It is important to interpret this: in reality, a France victory is no more likely than seeing a goalkeeper save a penalty.
This data goes to show that a European Championship is difficult to predict. And that's no surprise. Firstly, it is a tournament designed for luck to play a part: it is not a regular league, it has no playoffs, no home-and-away matches. Secondly, national teams play few genuinely big games and their performance is more uncertain than that of a club. And thirdly, football is full of surprises. Hardly anyone would sit down to watch a match if the result was a foregone conclusion.
Have you done this before? Yes. We used a similar model for the 2018 and 2022 World Cups. The model has proven to be well calibrated: outcomes to which we assigned a probability of between 0% and 15% occurred 4% of the time, for example, and those with 85% or 100% probability occurred 94% of the time. In 2018, we did much better than fate, better than the FIFA ranking and better than two big banks (UBS and Goldman Sachs), even though France won, Les Bleus being our sixth-placed favorite to start with. In 2022, the final was contested between two of the three teams we saw as the best, and we even beat the bookies.
Should I bet using your forecasts? No. Our model is relatively sophisticated and can work well. But the bookies have shown in the past that they are very difficult to get the better of. Moreover, in order not to lose money, it is not enough to beat them; you also have to compensate for the margin that bookmakers reserve for themselves when setting prices.
Statistical models are useful as a reference, for transparency, and because they allow us to calculate details that betting companies do not answer. But, when it comes to getting it right, bookmakers use a hybrid approach: they combine their own models with the fine-tuning performed by their experts, to take into account the extra information they have (such as details of playing styles, form, or injuries).
More technical details
What is an ELO ranking? It is a metric that captures the strength of each team according to their results. Each team has a certain number of points — its ELO points — and with each match an exchange takes place. The winner takes points from the loser. If the victory is a surprise (because the weaker team wins) the teams exchange more points. ELO rankings work well and are increasingly used in sports and in video games, for example, to organize matches between players of similar level. Our model uses the ELO ranking of the Eloratings website.
Why do you use squad values? Because national teams play relatively few competitive matches and that makes it difficult to measure their performance before a big event. One way to add information to the model is to use the transfer market value of the players in the squad. We take the data from the popular Transfermarkt website, adjusted for the age of the players (those over 30 are cheaper because they have fewer years of career ahead of them).
How does the match simulator work? We have adjusted a simple model that estimates the number of goals each team will score based on whether they are better or worse than their opponents, in ELO points, and squad value. The model also takes into account whether the matches have a host or are played on neutral ground, but that hardly influences the European Championship. We use a Poisson-type distribution, which adjusts reasonably for goals and has been used in statistical models and academic studies.
In the end, for our model, the probability of a team winning a match depends on numbers: the differences with the opponent in ELO points and in squad value. The graph summarizes it with numbers:
Why do we use a model that predicts goals and not wins directly? It has two advantages: it helps us to predict the group stage and extra time (as 30-minute matches). Some studies (since Dixon & Coles, 1997) say that models that predict goals underestimate the draws that occur. We have found this to be the case in the Champions League and in the major European leagues, but the effect is smaller in World Cups, and we have decided not to make this adjustment for the European Championship.
How accurate can we expect the model to be? To calibrate it, we used a database of 18,000 national team matches played since 2004, including hundreds from World Cups and European Championships.
With training data, the model predicts the outcome of 60% of home matches and 56% of neutral ground matches. Evaluated in probabilistic terms, the model's predictions score between 0.176 and 0.186 (expressed with a Ranking Probability Score (as here, and here). A reasonable level of accuracy, if we compare it with other models or betting companies.
You can also read the evaluation we did of our 2018 model (spanish) and in 2022 (also in Spanish), after each World Cup.
Sign up for our weekly newsletter to get more English-language news coverage from EL PAÍS USA Edition