Zipcode check: How did your neighbor vote in the 2019 Spanish election?
Here is a detailed interactive map of the results of Sunday’s poll, down to each street block
The results of the Spanish general election on Sunday tell a story, one that can be better appreciated by looking at the votes in each neighborhood. This allows us to see how political preferences can shift just by crossing the street, and in what areas minority parties were able to secure the biggest percentage of the vote.
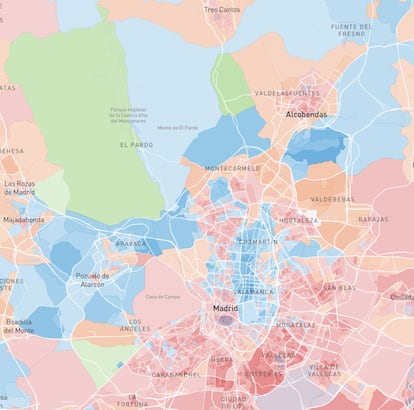
EL PAÍS has put together an interactive map of the results using voting information from each census section (an area comprising 1,500 residents), after requesting data from all the delegations of the Spanish government in these areas. Here are the most striking findings – blue represents the Popular Party (PP), red is the Socialist Party (PSOE), purple is Podemos, yellow is the Catalan Republican Left (ERC), which supports Catalan independence, and green is the far-right party Vox.
Madrid. Vox did not win the highest percentage of the vote in any neighborhood in Madrid, but it received its best results in the north of the city. In more than one block, it was the most voted party. Meanwhile, the conservative Popular Party maintained its control of the Paseo de la Castellana area.
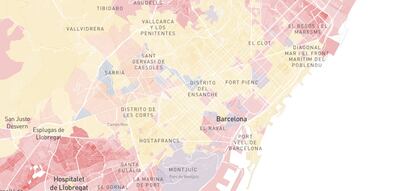
Barcelona. Like most of Catalonia, Barcelona voted for the Catalan Republican Left (ERC). The PP lost its control in the upper part of the city, where residents have the highest income.
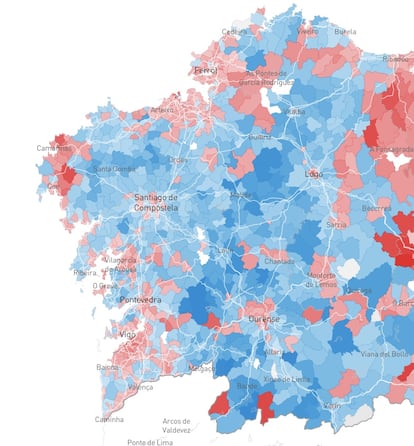
Galicia. The Socialist Party made surprise gains in small municipalities but also in cities like A Coruña, El Ferrol and Lugo, which were won by the PP at the 2016 polls.
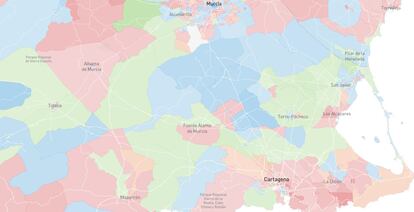
Murcia. Murcia is the second province and first provincial capital with the highest number of votes for Vox. Support for the far-right party also spread outside the cities.
Sources and methodology. The data used has been provided by the government delegations and subdelegations of all regions, and they are still provisional, which is why they have not been published yet. They do not include the vote of Spanish residents living abroad or take into account possible challenges at the polling stations. These disputes will be settled within three weeks. It has not been possible to include data from Girona province, because they were not available.
The census sections are defined by the National Institute of Statistics (INE) (2018). In less than 1% of census sections, data that corresponds to two sections are shown in one. This is due to updates made to the geographical records last year.
English version by Melissa Kitson.