Is the world sinking into a spiral of conflict?
The invasion of Ukraine has triggered a reshuffle of the global order. The G7, NATO, EU and BRICS summits all indicate a dangerous polarizing trend
The world is entering a phase of upheaval it hasn’t seen for decades. Russia’s war in Ukraine is one factor exacerbating the polarizing dynamics that were already evident in the tensions between the West and China. On the one hand, Western democracies are closing ranks with their Asian allies, as seen during the recent G7, NATO and EU summits. On the other, Russia and China are trying to join forces while attracting other countries, as indicated by last Thursday’s BRICS summit between its five member states – Brazil, Russia, India, China and South Africa.
The unusual accumulation of summits within a short space of time has flagged up this polarizing trend that is already having brutal and heartbreaking consequences, and which carries serious risks of further conflict in the near future. In it, the West retains preeminence in practically all areas, but China is gaining ground and Russia has energy and military assets of great strategic scope.
What the summits demonstrate is that the West has a higher level of internal cohesion. Russian aggression has caused NATO members to close ranks, with Sweden and Finland now keen to join. The conflict has also brought Western and Eastern democracies such as Japan and South Korea onto the same page. Meanwhile, despite the overtures of friendship, the relationship between Russia and China still has a limited trajectory, and the final declaration at the BRICS summit exposes the tricky terrain separating the two.
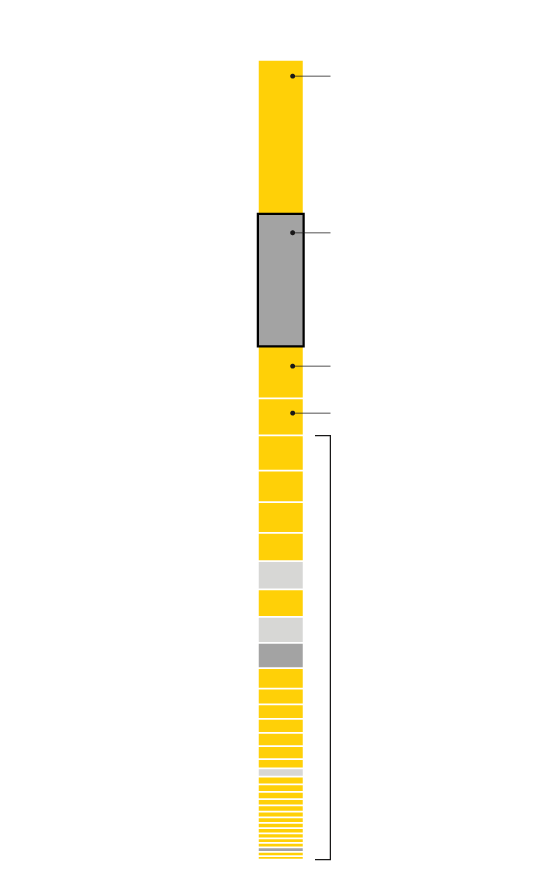
Meanwhile, the cohesion between NATO allies, which accounts for more than half of world military spending, is being shored up by the bond between Western powers and their partners in the Asia-Pacific region. The 29 countries providing military assistance to Ukraine also account for more than half of global military spending. Moreover, given the Russian aggression, several countries in the Western hemisphere are planning consistent increases in military investment over the coming years.
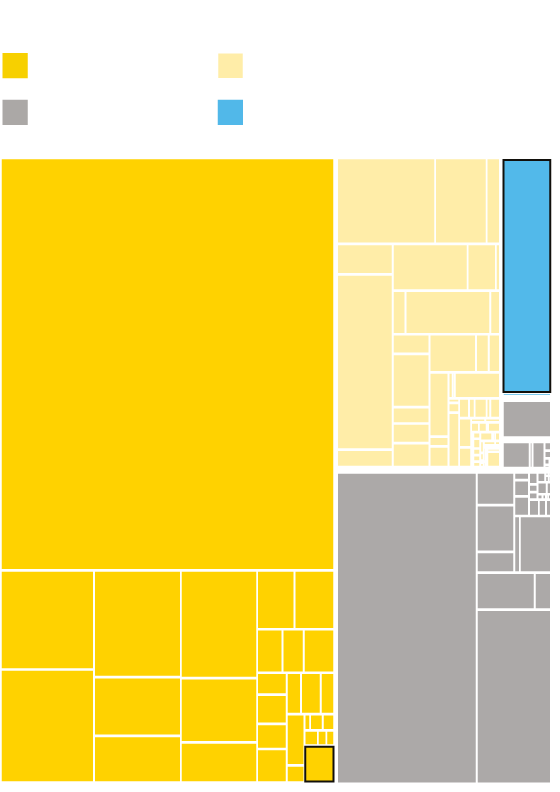
Military spending in the world
Military aid
Against the invasion
Abstention
In favor of the invasion
US
Japan
Rusia
3.5%
China
Iran
Germany
India
France
UK
Italy
Ukraine
0.3%
Spain

Military spending in the world
Military aid
Against the invasion
Abstention
In favor of the invasion
US
Japan
Rusia
3.5%
China
Iran
Germany
France
India
UK
Italy
Ukraine
0.3%
Spain

Military spending in the world
Abstention
Military aid
Against the invasion
In favor of the invasion
US
Japan
Brazil
Russia
3.5%
Saudi
Arabia
China
Iran
Germany
France
India
UK
Italy
Ukraine
0.3%
Canada
Spain
In the field of technology, the US and its democratic allies retain a considerable advantage, thanks to the muscle of so many cutting-edge American companies, giving them a major strategic advantage. In the same vein, coordination between Western countries in the field of intelligence is far more efficient than the looser cooperation between Beijing and Moscow.
Even so, China is rapidly gaining ground both militarily and technologically, due to huge investment and a thriving ecosystem of powerful companies. Europe, on the other hand, is lagging behind in this area, and is seeking to make up the shortfall with plans to strengthen its strategic autonomy.
Within this context, it is worth noting the importance of Taiwan, which has a strong microchip sector, and could well be a point of conflict between the two global powers, with China determined to bring it back into the fold, and the US committed to keeping Taiwan as a democratic territory.
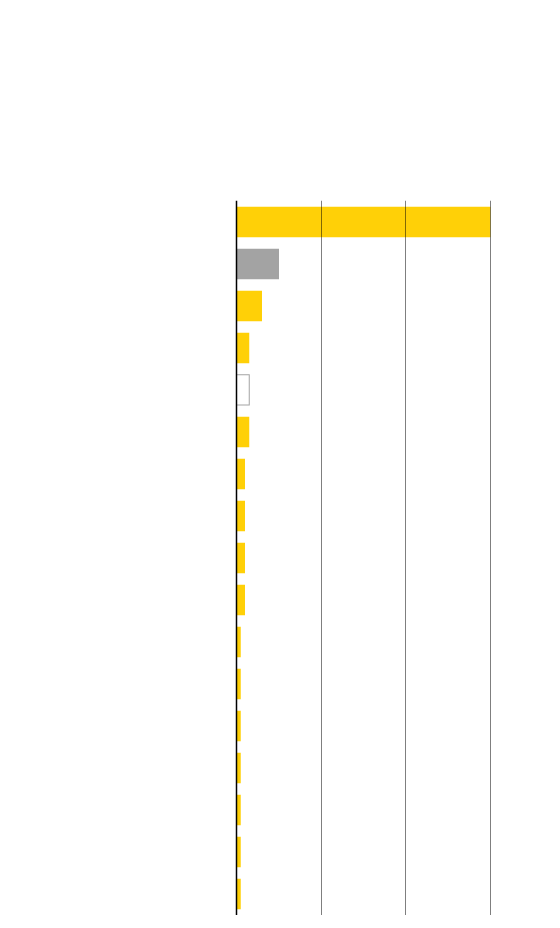
Location of main tech
companies in the world
Based on market capitalization.
Number of businesses
60
US
China
10
6
Japan
3
South Korea
3
Taiwan
The Netherlands
3
Germany
2
France
2
Canada
2
2
Switzerland
1
Australia
1
Spain
1
Finland
1
Sweden
1
Singapore
1
Argentina
1
Indonesia

Location of main tech companies
in the world
Based on market capitalization.
Number of businesses
60
US
China
10
Japan
6
South Korea
3
Taiwan
3
The Netherlands
3
Germany
2
France
2
2
Canada
2
Switzerland
1
Australia
1
Spain
1
Finland
1
Sweden
1
Singapore
1
Argentina
1
Indonesia

Location of main tech companies in the world
Based on market capitalization. Number of businesses
US
60
China
10
Japan
6
South Korea
3
Taiwan
3
The Netherlands
3
Germany
2
2
France
2
Canada
2
Switzerland
1
Australia
1
Spain
1
Finland
1
Sweden
1
Singapore
1
Argentina
1
Indonesia
Although the advantage the Western network has over China and Russia as a whole is clear, it would be a mistake to overestimate it, or to underestimate the potential of its adversaries. The West’s ability to maintain a cohesive and incisive course is being challenged by the very serious repercussions of the war in Ukraine. The foundations of its union are not in question, but its capacity to project a united and strong position is. The unrest exacerbated by both the conflict itself and sanctions against Russia, in terms of price escalation, supply shortages and potential waves of migration, may foster public dissent and threaten the cohesion.
While there is nothing comparable to NATO’s close military alliance, or the EU’s political and economic cooperation, there are a number of key risk factors. For example, China and India have significantly increased their purchase of Russian crude oil. They do so at a discount but, even so, their investment substantially compensates for the blow dealt to the Russian oil industry by Western sanctions, which is of enormous strategic importance.
Energy dominance is the most obvious aspect of the ongoing global reshuffle that goes beyond the disconnect with Russian fossil fuels. The growing distrust of China is prompting not just reflection but action in the West regarding the reorganization of production chains. The strategic aim of liberal democracies is to become less dependent on China’s manufacturing power and acquire greater autonomy. It will be a gradual but far-reaching process.
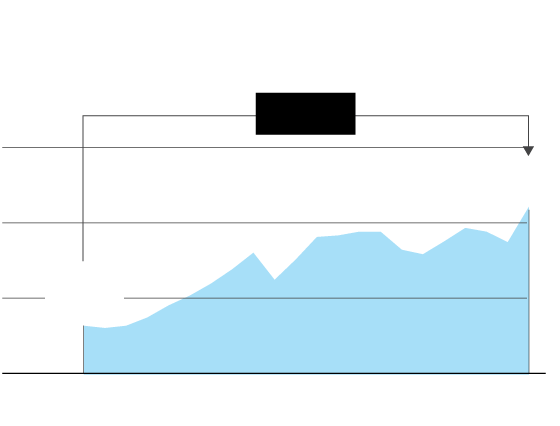
Global exports
In trillions of dollars
+245%
30
22.3
20
10
6.45
0
2000
2021

Global exports
In trillions of dollars
+245%
30
22.3
20
10
6.45
0
2000
2021

Global exports
In trillions of dollars
+245%
30
22.3
20
10
6.45
0
2000
2021
Even so, it is premature to interpret this as leading to de-globalization. Rather, it looks as though it might be a redesign of our globalization model. The scale of economic and trade ties is enormous and in some respects, these serve to check the polarizing forces.
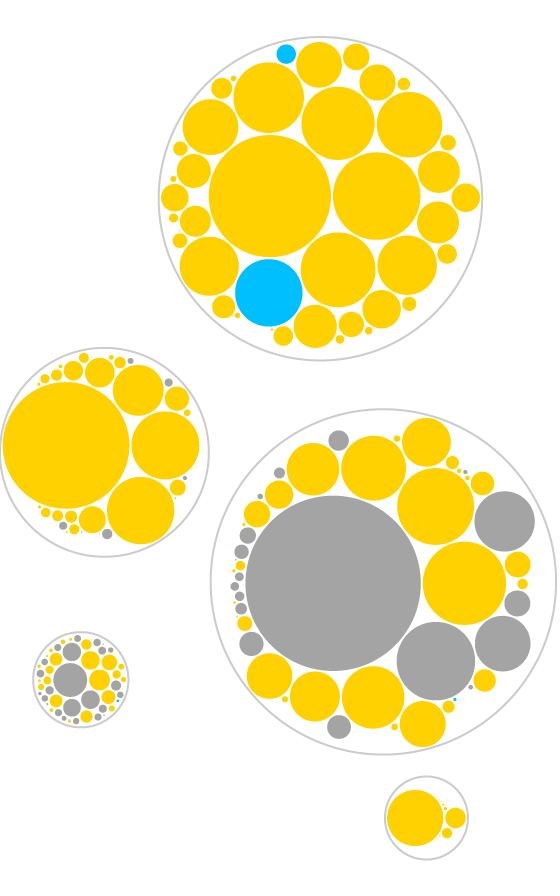
The export data shows which countries have a special interest in maintaining a global order with a stable trade framework. China and Germany stand out as the two export giants. During its presidency of the EU in the second half of 2020, Germany pushed for the signing of a new agreement with Beijing on investment and trade. The pact, however, has foundered in the subsequent ratifying of the accord.
Awareness of the need to reduce dependence on the Chinese market has been growing in Europe, particularly in the German industrial sector, adding weight to the divergence of the US, which began in the Trump era with a trade war, and continues – with somewhat less animosity, but a similar approach – under the Biden presidency.
Global exports
In trillions of dollars
Europe
France
585
UK
468
The
Netherlands
836
Germany
1.631
Italy
610
Russia
494
America
Asia
US
1.754
Canada
503
Mexico
494
India
395
China
3.364
Japan
756
Africa
Australia
344
Oceania

Europe
France
585
UK
468
The
Netherlands
836
Germany
1.631
Italy
610
Russia
494
America
Asia
US
1.754
Canada
503
Mexico
494
India
395
China
3.364
Japan
756
Africa
Australia
344
Oceania

Some 41% of global trade comes from Asian countries.
Europe
France
585
UK
468
Asia
The
Netherlands
836
Germany
1.631
America
India
395
Italy
610
Russia
494
China
3.364
Japan
756
US
1.754
Canada
503
Mexico
494
Africa
Australia
344
Oceania

Europe
Some 41% of global trade comes from Asian countries. China alone accounts for 15% of global exports.
America
United
Kingdom
468
France
585
Asia
US
1.754
Canada
503
The
Netherlands
836
Germany
1.631
Mexico
494
India
395
Italy
610
Russia
494
China
3.364
Japan
756
Africa
Australia
344
Oceania
The commercial ties between the world’s two giants run deep. China is the largest import market for the US, and the US is the largest export market for Beijing. But things are changing. Apple – perhaps the biggest symbol of the link between US technology and Chinese manufacturing – is moving production lines to Vietnam, where it will start manufacturing devices such as iPad and AirPods. Many other companies are following suit, though the involvement runs so deep and is so lucrative that the process will necessarily be gradual.

Where the US imports from
China 18.4%
Mexico 14.1%
Canada 12.7%
Germany 5.1%
Vietnam 2.7%
UK 2.5%
India 2.3%
France 2.3%
Brazil 1.2%
Russia 0.9%
Where China exports to
US 16.8%
Hong Kong 11.2%
Japan 5.7%
India 2.9%
UK 2.5%
Russia 2.0%
Mexico 1.8%
Brazil 1.4%
Spain 1.1%

Where the US imports from
China 18.4%
Mexico 14.1%
Canada 12.7%
Germany 5.1%
Vietnam 2.7%
United Kingdom 2.5%
India 2.3%
France 2.3%
Brazil 1.2%
Russia 0.9%
Where China exports to
US 16.8%
Hong Kong 11.2%
Japan 5.7%
India 2.9%
United Kingdom 2.5%
Russia 2.0%
Mexico 1.8%
Brazil 1.4%
Spain 1.1%

Where the US imports from
Where China exports to
China 18.4%
US 16.8%
Hong Kong 11.2%
Mexico 14.1%
Japan 5.7%
Canada 12.7%
India 2.9%
Germany 5.1%
UK 2.5%
Vietnam 2.7%
UK 2.5%
Russia 2.0%
India 2.3%
Mexico 1.8%
France 2.3%
Brazil 1.2%
Brazil 1.4%
Russia 0.9%
Spain 1.1%

Where the US
imports from
Where China
exports to
China 18.4%
US 16.8%
Hong Kong 11.2%
Mexico 14.1%
Japan 5.7%
Canada 12.7%
India 2.9%
Germany 5.1%
UK 2.5%
Vietnam 2.7%
UK 2.5%
Russia 2.0%
India 2.3%
Mexico 1.8%
France 2.3%
Brazil 1.2%
Brazil 1.4%
Russia 0.9%
Spain 1.1%
The financial sector is another intertwined element, with China as one of the US Treasury’s main creditors. The different interwoven elements of the relationship between the US and China are of particular importance for reading a world order undergoing metamorphosis. Russia wields a strategic influence and harbors a strong capacity for destabilization due to its nuclear arsenal, energy resources and geographical size, but the future depends largely on what kind of relationship the two true superpowers will maintain, and on the positioning of other key players, such as the EU, India and Russia itself, on the chessboard shaped by the two titans.
Which countries own US debt
Owners of US
sovereign debt
in March 2021
Japan 18%
China 15.5%
UK 6.1%
Ireland 4.3%
Rest 49.7%

Which countries own US debt
Owners of US
sovereign debt
in March 2021
Japan 18%
China 15.5%
United Kingdom 6.1%
Ireland 4.3%
Rest 49.7%

Which countries own US debt
Owners of US sovereign debt in March 2021
United
Kingdom
6.1%
Japan
18%
China
15.5%
Ireland
4.3%
Rest 49.7%
In the financial sector, as well as the military and technology sectors, the US continues to enjoy enormous preeminence thanks to the dollar and its dominant position in global markets. It is by far the most widely used currency in transactions and the one most frequently used for reserves.
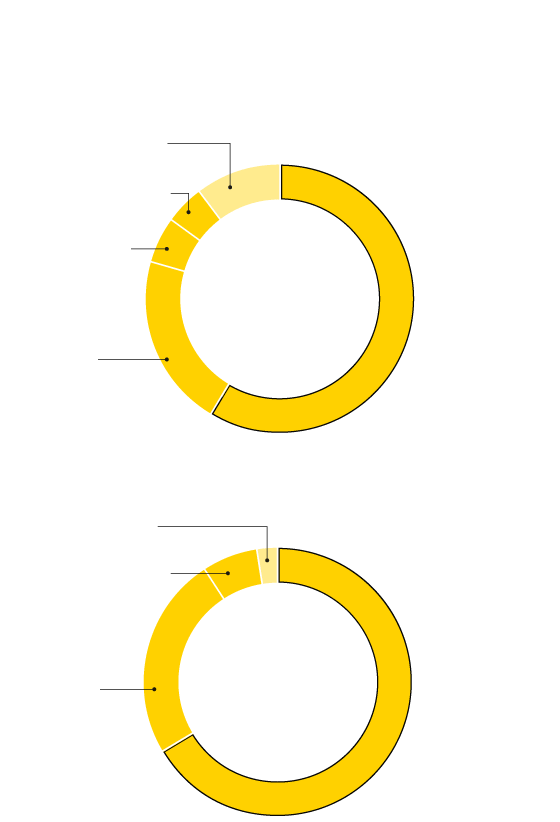
Importance of the US dollar
In reserve
Rest 10.2
Pound 4.8
Yen 5.6
US dollar
58.8%
Euro
20.6
In use
Rest 2.5
Pound 6.6
US dollar
66.6%
Euro
24.3

Importance of the US dollar
In reserve
Rest 10.2
Pound 4.8
Yen 5.6
US dollar
58.8%
Euro
20.6
In use
Rest 2.5
Pound 6.6
US dollar
66.6%
Euro
24.3

Importance of the US dollar
In reserve
In use
Rest 2.5
Rest 10.2
Pound 6.6
Pound 4.8
Yen 5.6
US
dollar
58.8%
US
dollar
66.6%
Euro
24.3
Euro
20.6
The energy sector is another determining factor in the current upheaval. The war in Ukraine has created shockwaves, with the West determined to do without Russian fossil fuels. The EU suffers from a high dependence on Russian fuel, which is causing particular turbulence. The impact on inflation is already high, and Russia seems determined to use this tool aggressively, as evidenced by recent measures to reduce supplies to Germany and Italy, two of its major customers.
The Kremlin probably believes that it can largely offset the losses from these exports by hiking prices and redirecting – especially of the more manageable crude oil – to other Asian customers. It also seems to believe it will be able to manage the suffering of Russian society – subjected to severe repression – better than European governments can manage the increasing pressure from a public anxious about the deteriorating situation, which could lead to a shift in their current foreign policies.
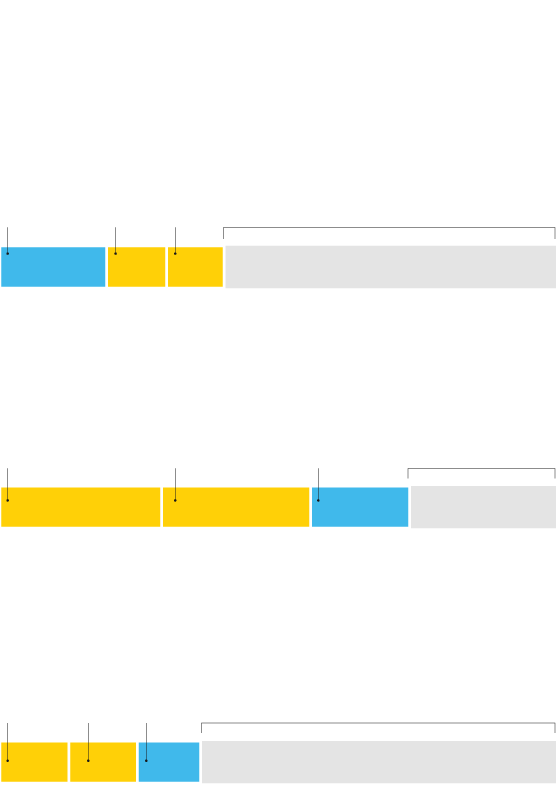
Gas, oil and coal exports in 2020
Gas
Liquified and via pipeline
Russia
19.2%
US
10.8%
Qatar
10.3%
Rest of the world
59.7%
Coal
Rest of
the world
26.3%
Australia
29.1%
Indonesia
26.8%
Russia
17.8%
Oil
Crude and petroleum products
S. Arabia
12.4%
US
12.3%
Russia
11.4%
Rest of the world
63.9%

Gas, oil and coal exports in 2020
Gas
Liquified and via pipeline
Russia
19.2%
US
10.8%
Qatar
10.3%
Rest of the world
59.7%
Coal
Rest of
the world
26.3%
Australia
29.1%
Indonesia
26.8%
Russia
17.8%
Oil
Crude and petroleum products
S. Arabia
12.4%
US
12.3%
Russia
11.4%
Rest of the world
63.9%

Gas, oil and coal exports in 2020
Gas
Russia
19.2%
US
10.8%
Qatar
10.3%
Rest of the world
59.7%
Liquified and
via pipeline
Australia
29.1%
Indonesia
26.8%
Russia
17.8%
Rest of the world
26.3%
Coal
Oil
S. Arabia
12.4%
US
12.3%
Russia
11.4%
Rest of the world
63.9%
Crude and
petroleum
products
The severing of energy ties with Russia is indicative of the depth and breadth of the current conflict. This, together with the reconfiguration of supply chains and the tightening of alliances such as the Aukus (Australia, UK, US), indicate that polarizing forces are prevailing.
The main polarizing forces are, of course, seeking to attract more neutral countries into their orbit. Significantly, the BRICS summit invited a dozen countries to attend, including Iran, Indonesia, Algeria and Argentina. The G7, in turn, has invited India, South Africa, Senegal and Argentina, while NATO has invited Asian leaders from countries such as Australia, Japan, South Korea and New Zealand for the first time. This is the great 21st century game. And the risk of war is much higher than in previous decades.
Sources: IMF, World Trade Organization, WITS, US Treasury Department, SIPRI, Kiel Institute for the World Economy, International Energy Agency and companiesmarketcap.com.